How to create an IT cost optimization report and monitor your IT spending
InvGate Asset Management makes it easy to create an IT cost optimization report packed with valuable insights, thanks to its ability to collect, organize, and visualize the financial information linked to your IT assets.

We’ll walk you through:
- How to build a dashboard with key insights to monitor your IT spending.
- How to create a report on specific IT cost optimization metrics.
#1. How to build a custom dashboard with key insights to monitor your IT spending

Creating a dedicated dashboard to gain valuable insights is key to optimizing your IT spending. However, the specific charts it includes may vary depending on each organization’s goals and priorities.
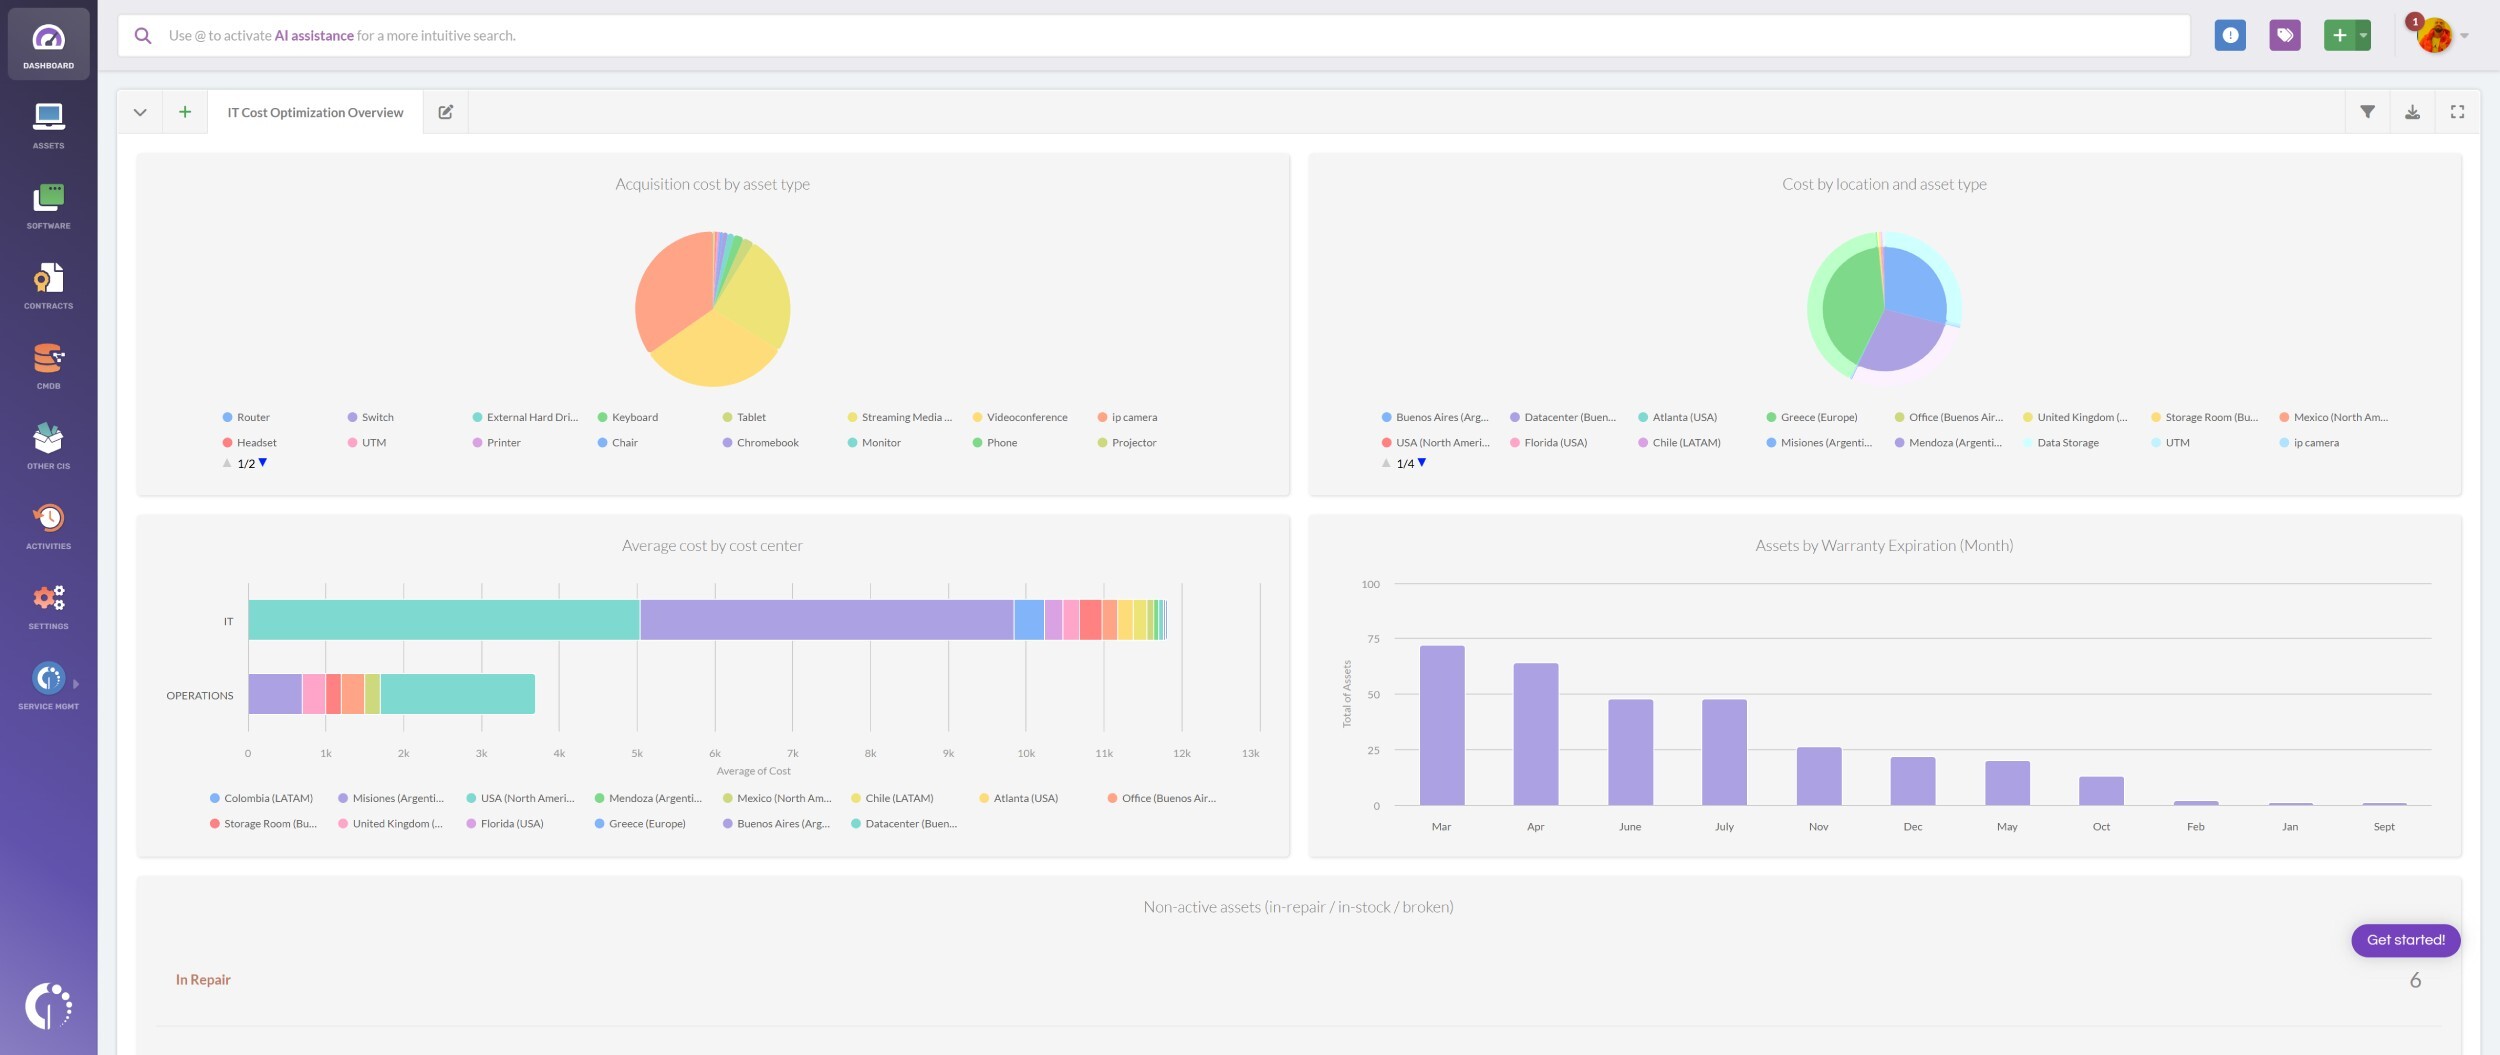
To help you get started, here’s a suggested dashboard with 10 powerful indicators:
- Acquisition cost by asset type
- Cost by location and asset type
- Average cost by cost center
- Hardware refresh tracker
- Assets by warranty expiration (month)
- Non-active assets (in-repair / in-stock / broken)
- Assets with open requests by location
- Assets with offline connectivity
- Open requests by type
- Maximum software usage
These financial, operational, and efficiency metrics strike a solid balance to support informed decision-making. Now, let’s walk through the steps to create the dashboard – and some of the key charts to include.
- Go to Dashboards.
- Click the “+” icon to create a new dashboard.
- Don’t apply any general filters for now.
- Fill in the following fields:
- Name: IT Cost Optimization Overview.
- Description: A visual dashboard to monitor key metrics and reduce unnecessary IT spending.
- Click Chart and select the following options:
- Visualization: Bar stacked (or pie).
- Metric: Acquisition cost - Total.
- Dimension: General > Asset type.
- Drilldown: Location (optional, for extra detail).
- Filters: None needed for this chart unless you want to narrow it by cost center, location, or tag.
- Name the chart “Acquisition cost by asset type” and click Save to save the chart.
Note: Adding charts is simple – they all follow the same logic. We'll use the creation of the “Acquisition cost by asset type” chart as an example.
Note: You can repeat this process to add the rest of the charts based on your reporting needs.
#2. How to create a weekly “non-active assets” report to help with IT spend optimization

While dashboards are great for visual monitoring, reports allow you to track and export detailed data on specific metrics. In InvGate Asset Management, you can create custom views based on filters – and then automate them to receive regular updates via email.
Here’s how to build a weekly report on a key IT cost optimization metric. We’ll use “Non-active assets” as an example, since these often represent hidden costs without delivering value.
- Go to Assets.
- Click the “+” button to create a new view.
- Click on the filters button to apply new filters.
- Add the following filters:
- Assets > Status > is > In Repair.
- Assets > Status > is > In Stock.
- Click Update. You’ll see your non-active assets.
- Click the Save icon.
- Choose an icon and name the view: “Non-active assets”.
- Add a description if you need to clarify its purpose.
- Click Save.
- Click the hamburger icon (☰) to see all your saved views.
- Find the “Non-active assets” view and click the clock icon to schedule a report.
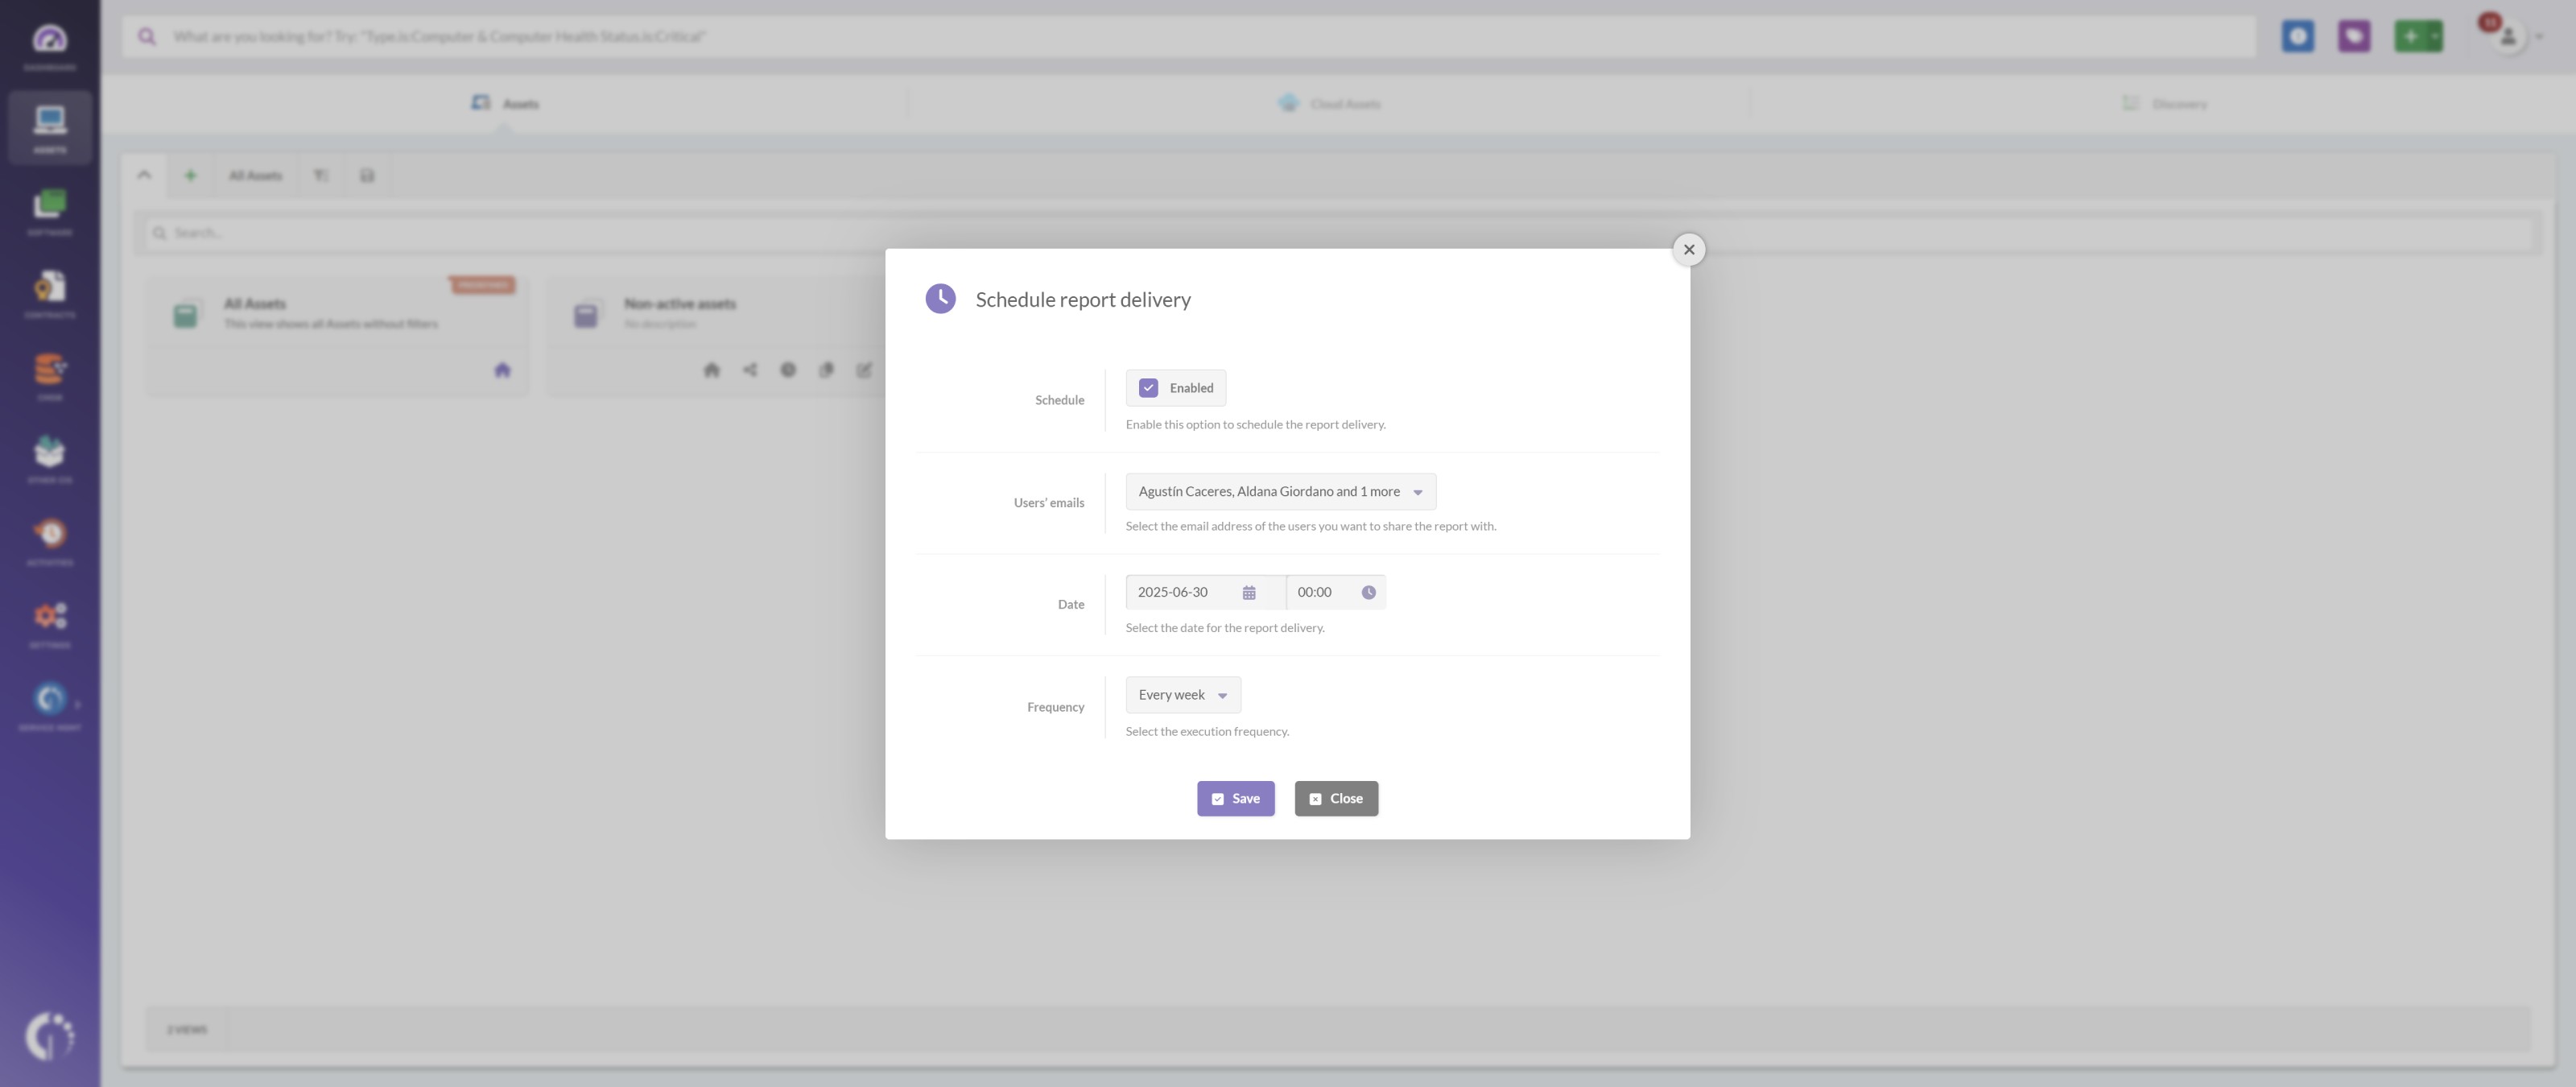
- In the Schedule report delivery pop-up:
- Enable the Schedule option.
- In Users' emails, select the recipients who should receive the report.
- Set the date and time for the delivery.
- Choose Every week.
- Click Save to confirm the schedule.
Note: We’re using these two filters because they include assets that are currently not in use. You can always add more filters if needed, depending on the level of detail you want to achieve.
Note: The assigned users will now receive the report by email at the selected frequency. You can create a new view for each of the indicators mentioned in the first section and assign different delivery frequencies based on their relevance. You can also share reports with people who don’t have a user account in the tool.