How to overcome the break/fix lifecycle by monitoring asset status
InvGate Asset Management helps you move beyond the break/fix model to save money, energy, and time. Instead of waiting for your assets to fail and scrambling to fix them, you can monitor their status and take preventive actions before issues arise.
There are many variables you can track to get an accurate picture of your assets' condition — and ultimately, to know which ones need attention. We recommend focusing on the following:
- Asset status and health.
- Warranty status.
- End-of-life status.
- Value and depreciation.
#1. Create specific health rules
“Assets by Health” lets you categorize assets as Safe, Warning, or Critical based on criteria like warranty status, number of open tickets, or battery usage.
While each of these conditions could be tracked individually, defining them as health rules allows you to group assets that meet at least one of these conditions into a single, easy-to-read chart, perfect for quick, overall reviews.
To add a specific health rule to monitor the number of requests tied to an asset, do the following:
- Go to Settings > CIs > Health.
- Click Add and fill the next field:
- Name: Number of requests.
- Description (optional): Numbers of open requests tied to the asset.
- Enable the option “Global”.
- Filter: Number of open requests (quantity) > 30 > Critical.
Pro tip: Add filters to set when an asset should be marked as Warning or Critical. We suggest creating rules based on antivirus, firewall, warranty status, ticket volume, and battery usage.
#2. Create an EOL date custom field
Our platform offers plenty of variables to create meaningful charts about your assets’ status. However, if you need to monitor something more specific, you can always create a custom field — for example, each asset’s end-of-life date. Here is how to do it:
- Go to Settings > CIs > Fields.
- Click Add to create a new asset field and fill in the following details:
- Name: EOL date (next month).
- Description (optional): This field allows the IT team to set an EOL date.
- CI type: Assets.
- Asset types: All assets.
- Field type: Date.
- Click Save.
Note: Custom fields let you track a wide range of information. End-of-life date is one example, but you can also include fields like purchase date and more.
#3. Monitor charts on our pre-defined “CI Status” dashboard
Before creating your own custom dashboard, remember that InvGate Asset Management includes built-in charts in its pre-defined “CI Status” dashboard.
This includes “Assets by Status” and “Assets by Health”, two basic metrics to start moving away from the break/fix model.
- Go to Dashboard.
- Click on the dashboard CI Status.
- Scroll down until you see “Assets by Status” and “Assets by Health”.
#4. Create your own dashboard for deeper insights
The “CI Status dashboard” is a good start, but we recommend building a dedicated dashboard to extend its capabilities. Here are the charts we suggest including:
- Assets by health rules (remember, you can define what qualifies as a “healthy” asset).
- Assets by end-of-life status (we already created a specific custom field for this).
- Assets by warranty status.
- Assets by last connection.
- Assets by status.
- Assets by depreciation.
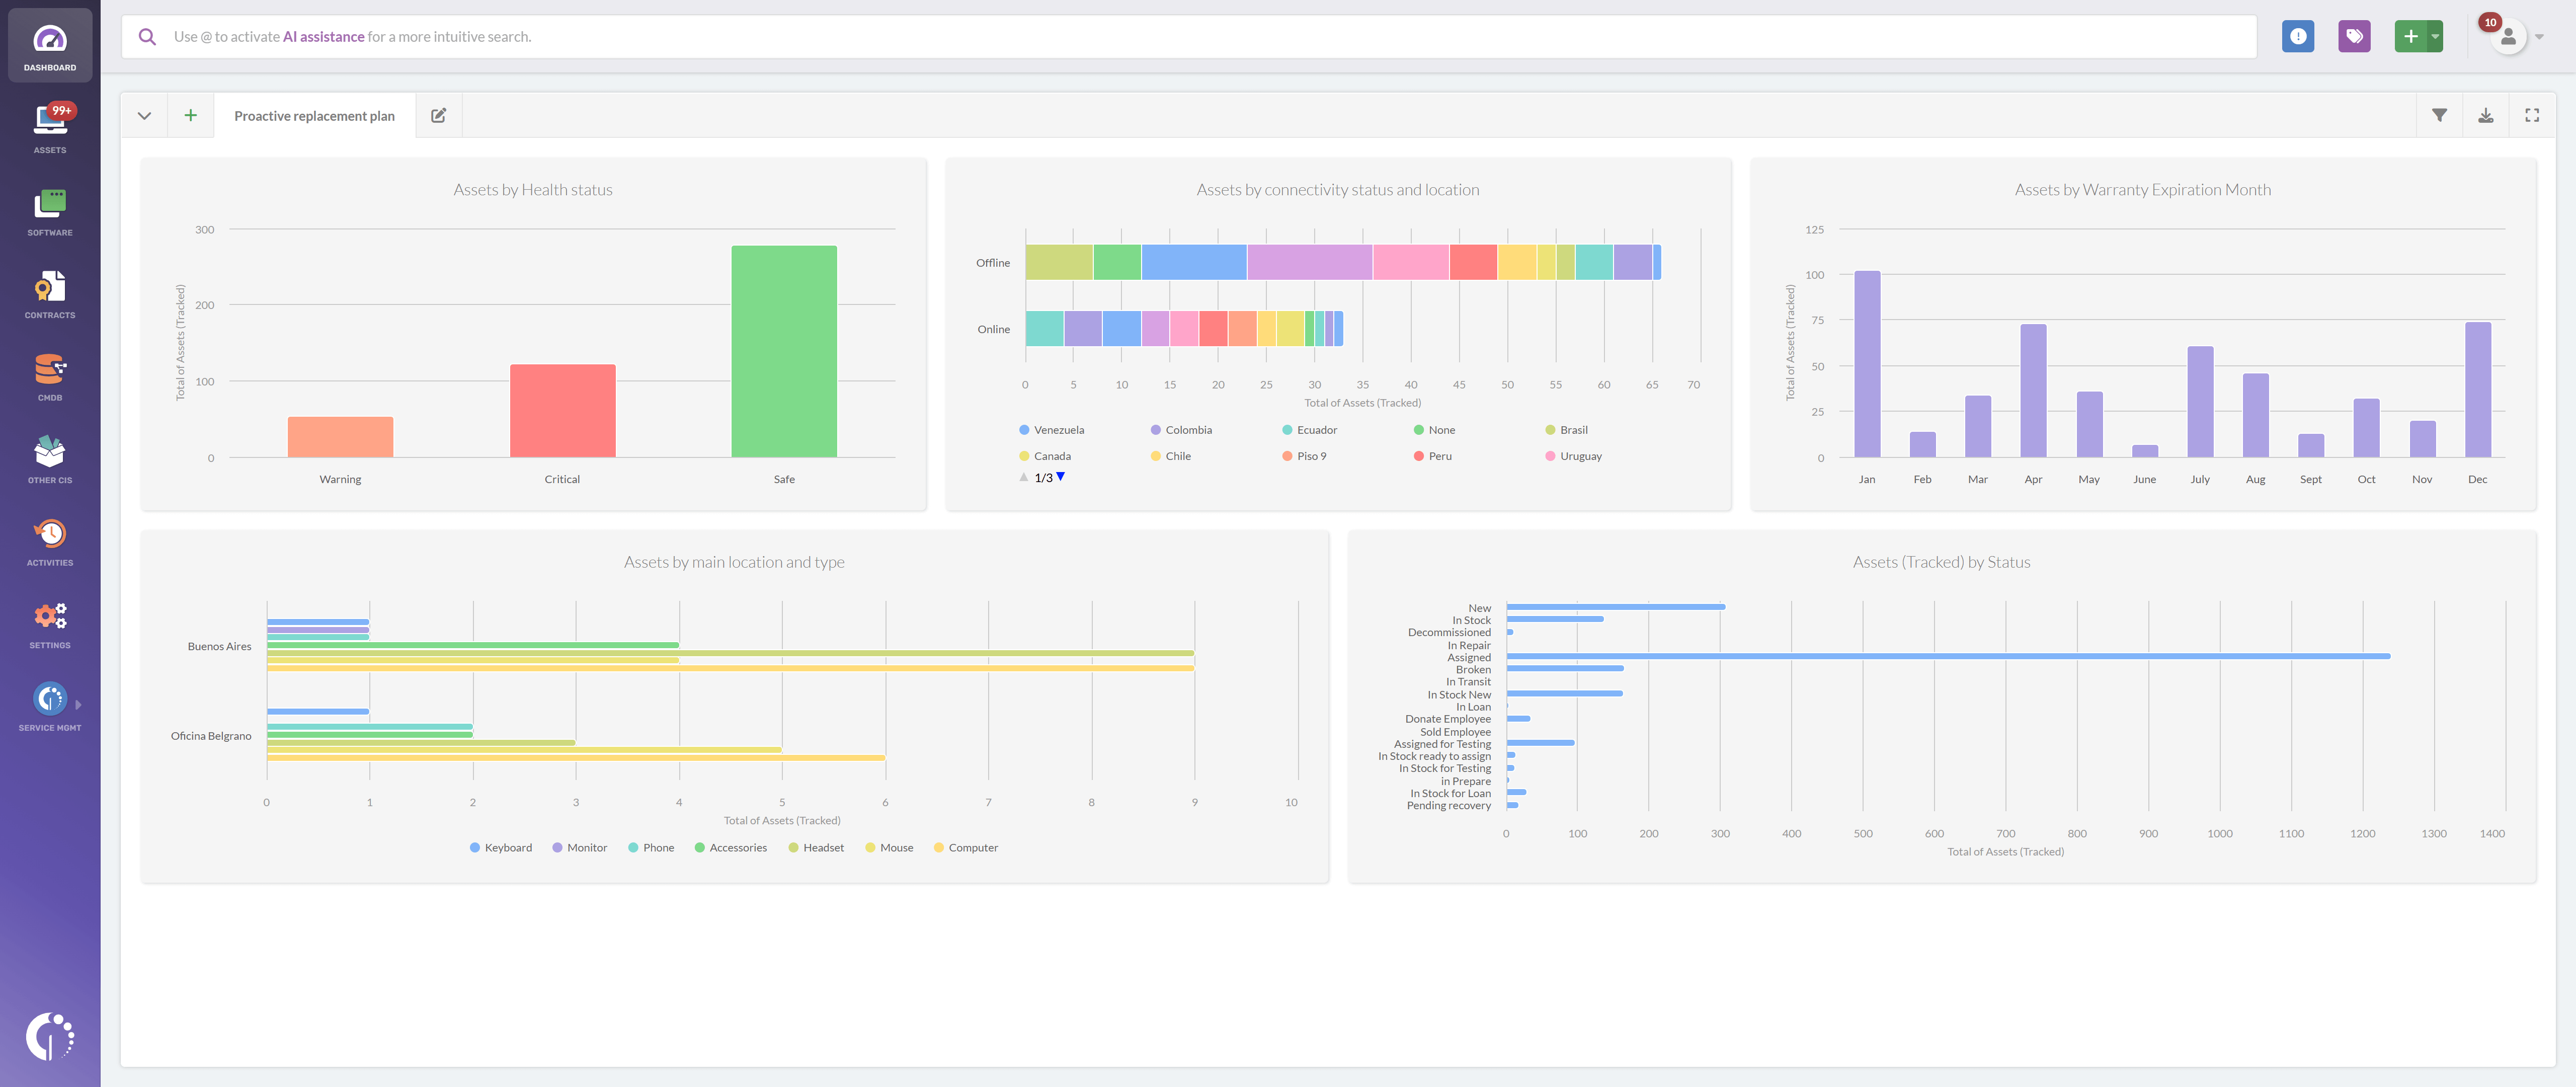
How to create a “Proactive replacement” plan dashboard

- Go to Dashboard.
- Click the “+” icon to create a new dashboard.
- Don’t apply any general filters for now.
- Fill in the following fields:
- Name: Proactive replacement plan.
- Description: A visual overview of key metrics to avoid bre/fix model.
- Click Chart and select the following information:
- Visualization: Columns stacked - Without order.
- Metric: Assets (Tracked) - Total.
- Dimension: Warranty Expiration (Month).
- Drilldown: None.
- Filter: Assets > Status is “In Stock”.
- Click Save to save the chart.
Note: Adding charts is simple — they all follow the same logic. So, we’ll use the creation of the “Assets by Warranty Status” chart as an example.
Note: Add as many charts as needed to support your proactive hardware replacement plan. Just switch the “Dimension” to the specific metric you want to gain insights from or add filters like Assets > Requests (Open) > is greater than > 10. To create this specific one, you’ll also need to have InvGate Service Management.